
| Country | Code | Education | Literacy |
|---|---|---|---|
| Afghanistan | AFG | 4.23 | 43.0 |
| Albania | ALB | 3.95 | 98.1 |
| Algeria | DZA | NA | 81.4 |
| Andorra | AND | 3.26 | NA |
| Antigua and Barbuda | ATG | NA | 99.0 |
| Argentina | ARG | 5.78 | 99.2 |
| Armenia | ARM | 2.81 | 99.7 |
| Aruba | ABW | 6.48 | 97.8 |
| Australia | AUS | 5.32 | NA |
| Austria | AUT | 5.50 | NA |
| Azerbaijan | AZE | 2.95 | 99.8 |
| Bahrain | BHR | 2.67 | 97.5 |
| Bangladesh | BGD | 2.47 | 73.9 |
| Barbados | BRB | 5.09 | NA |
| Belarus | BLR | 4.95 | 99.8 |
| Belgium | BEL | 6.54 | NA |
| Belize | BLZ | 7.38 | NA |
| Benin | BEN | 4.36 | 42.4 |
| Bermuda | BMU | 1.70 | NA |
| Bhutan | BTN | 7.39 | 66.6 |
| Bolivia | BOL | NA | 92.5 |
| Brazil | BRA | 6.24 | 93.2 |
| British Virgin Islands | VGB | 6.32 | NA |
| Brunei Darussalam | BRN | 4.43 | 97.2 |
| Burkina Faso | BFA | 4.17 | 41.2 |
| Burundi | BDI | 6.37 | 68.4 |
| Cabo Verde | CPV | 5.29 | 86.8 |
| Cambodia | KHM | NA | 80.5 |
| Cameroon | CMR | 3.07 | 77.1 |
| Central African Republic | CAF | NA | 37.4 |
| Chad | TCD | NA | 26.0 |
| Chile | CHL | 5.42 | 96.9 |
| China | CHN | NA | 96.8 |
| Colombia | COL | 4.50 | 95.1 |
| Comoros | COM | 2.49 | 58.8 |
| Congo, Dem. Rep. | COD | 2.17 | 77.0 |
| Congo, Rep. | COG | 4.56 | 80.3 |
| Costa Rica | CRI | 7.40 | 97.9 |
| Cote d'Ivoire | CIV | 5.39 | 47.2 |
| Cyprus | CYP | 6.38 | NA |
| Czech Republic | CZE | 5.79 | NA |
| Dominica | DMA | 3.39 | NA |
| Dominican Republic | DOM | NA | 93.8 |
| Ecuador | ECU | 5.00 | 94.5 |
| Egypt, Arab Rep. | EGY | NA | 71.2 |
| El Salvador | SLV | 3.96 | 88.5 |
| Eritrea | ERI | NA | 76.6 |
| Estonia | EST | 5.17 | NA |
| Eswatini | SWZ | NA | 88.4 |
| Ethiopia | ETH | 4.74 | 51.8 |
| Fiji | FJI | NA | 99.1 |
| Finland | FIN | 7.08 | NA |
| France | FRA | 5.46 | NA |
| Gabon | GAB | NA | 84.7 |
| Gambia, The | GMB | 2.06 | 50.8 |
| Georgia | GEO | 3.85 | 99.4 |
| Germany | DEU | 4.81 | NA |
| Ghana | GHA | 4.51 | 79.0 |
| Grenada | GRD | 10.24 | NA |
| Guatemala | GTM | 2.96 | NA |
| Guinea | GIN | 2.52 | NA |
| Guyana | GUY | 6.34 | NA |
| Haiti | HTI | 3.16 | 61.7 |
| Honduras | HND | 6.41 | 89.0 |
| Hong Kong SAR, China | HKG | 3.32 | NA |
| Hungary | HUN | 4.71 | NA |
| Iceland | ISL | 7.53 | NA |
| India | IND | NA | 74.4 |
| Indonesia | IDN | 3.58 | 95.7 |
| Iran, Islamic Rep. | IRN | 3.96 | 85.5 |
| Iraq | IRQ | NA | 50.1 |
| Ireland | IRL | 3.76 | NA |
| Israel | ISR | 5.85 | NA |
| Italy | ITA | 4.08 | 99.2 |
| Jamaica | JAM | 5.46 | NA |
| Japan | JPN | NA | NA |
| Jordan | JOR | 3.90 | 98.2 |
| Kazakhstan | KAZ | 2.98 | NA |
| Kenya | KEN | 5.36 | 81.5 |
| Korea, Rep. | KOR | NA | NA |
| Kuwait | KWT | NA | 96.1 |
| Kyrgyz Republic | KGZ | 6.59 | 99.6 |
| Lao PDR | LAO | NA | 84.7 |
| Latvia | LVA | 5.34 | NA |
| Lebanon | LBN | NA | 95.1 |
| Lesotho | LSO | 6.51 | NA |
| Liberia | LBR | NA | 48.3 |
| Lithuania | LTU | 4.22 | NA |
| Luxembourg | LUX | 3.96 | NA |
| Macao SAR, China | MAC | 3.08 | 96.5 |
| Madagascar | MDG | NA | 74.8 |
| Malawi | MWI | 5.61 | 62.1 |
| Malaysia | MYS | 4.97 | 93.7 |
| Maldives | MDV | 4.37 | 97.7 |
| Mali | MLI | 3.80 | 35.5 |
| Malta | MLT | 5.28 | 94.5 |
| Mauritania | MRT | 2.63 | 53.5 |
| Mauritius | MUS | 5.02 | 93.2 |
| Mexico | MEX | 5.24 | 95.4 |
| Micronesia, Fed. Sts. | FSM | 12.46 | NA |
| Moldova | MDA | 6.68 | NA |
| Monaco | MCO | 1.46 | NA |
| Mongolia | MNG | 5.18 | 98.4 |
| Montenegro | MNE | NA | 98.8 |
| Morocco | MAR | NA | 73.8 |
| Mozambique | MOZ | NA | 60.7 |
| Myanmar | MMR | 2.16 | 75.6 |
| Nepal | NPL | 5.16 | 67.9 |
| Netherlands | NLD | 5.48 | NA |
| New Zealand | NZL | 6.43 | NA |
| Nicaragua | NIC | 4.35 | 82.6 |
| Niger | NER | 6.02 | NA |
| Nigeria | NGA | NA | 62.0 |
| Norway | NOR | 7.98 | NA |
| Oman | OMN | 6.85 | 95.7 |
| Pakistan | PAK | 3.00 | 59.1 |
| Palau | PLW | NA | 96.6 |
| Panama | PAN | NA | 95.4 |
| Paraguay | PRY | 3.44 | 95.6 |
| Peru | PER | 3.97 | 94.4 |
| Philippines | PHL | NA | 98.2 |
| Poland | POL | 4.82 | NA |
| Portugal | PRT | 4.88 | 96.1 |
| Puerto Rico | PRI | NA | 92.4 |
| Qatar | QAT | 2.86 | 93.5 |
| Romania | ROU | 3.11 | 98.8 |
| Russian Federation | RUS | 3.83 | 99.7 |
| Rwanda | RWA | 3.75 | 73.2 |
| Samoa | WSM | 4.08 | 99.1 |
| San Marino | SMR | 3.04 | 99.9 |
| Sao Tome and Principe | STP | 5.08 | 92.8 |
| Saudi Arabia | SAU | NA | 95.3 |
| Senegal | SEN | 5.46 | 51.9 |
| Serbia | SRB | 4.04 | 98.8 |
| Seychelles | SYC | 4.42 | 95.9 |
| Sierra Leone | SLE | 4.64 | 43.2 |
| Singapore | SGP | NA | 97.3 |
| Slovak Republic | SVK | 4.64 | NA |
| Slovenia | SVN | 4.91 | NA |
| South Africa | ZAF | 6.16 | 94.4 |
| South Sudan | SSD | 1.50 | 34.5 |
| Spain | ESP | 4.27 | 98.4 |
| Sri Lanka | LKA | 3.48 | 92.4 |
| St. Kitts and Nevis | KNA | 2.61 | NA |
| St. Lucia | LCA | 5.80 | NA |
| St. Vincent and the Grenadines | VCT | 5.78 | NA |
| Sudan | SDN | NA | 60.7 |
| Suriname | SUR | NA | 94.4 |
| Sweden | SWE | 7.67 | NA |
| Switzerland | CHE | 5.11 | NA |
| Syrian Arab Republic | SYR | NA | NA |
| Tajikistan | TJK | 5.23 | NA |
| Tanzania | TZA | NA | 77.9 |
| Thailand | THA | NA | 92.9 |
| Timor-Leste | TLS | 5.29 | 68.1 |
| Togo | TGO | 5.11 | 63.7 |
| Tonga | TON | NA | 99.4 |
| Tunisia | TUN | 6.60 | NA |
| Turkey | TUR | NA | 96.2 |
| Turks and Caicos Islands | TCA | 3.16 | NA |
| Uganda | UGA | 2.77 | 76.5 |
| Ukraine | UKR | 5.41 | NA |
| United Kingdom | GBR | 5.61 | NA |
| Uruguay | URY | 4.87 | 98.7 |
| Uzbekistan | UZB | 7.08 | 100.0 |
| Vanuatu | VUT | 5.55 | 87.5 |
| Venezuela, RB | VEN | NA | 97.1 |
| Vietnam | VNM | 4.34 | 95.0 |
| West Bank and Gaza | PSE | 5.72 | 97.2 |
| Zambia | ZMB | NA | 86.7 |
Introduction to Statistics
STAT 120
Let’s do an introduction!
- Your name?
- What gender pronouns do you use?
- Favorite Scientist/Person?
- Recent fun memories?
What will you learn in this course?
- Analyzing data by doing exploratory data analysis
- Estimate some parameter of interest from the population
- Infer the population characteristics based in your estimation
- Quantify the uncertainty in the estimation
What will a typical day/week look like?
Before Class:
- Some reading to introduce some topics
- Daily quizzes
What will a typical day/week look like?
During Class:
- Mini-lectures
- Hands-on class activities
What and Why of Statistics?
Science of collecting, describing, analyzing and making decisions based on data
- Sampling
- Exploratory Data Analysis
- Inference
Allows us to make informed decisions in the face of uncertainty and let’s us take an unbiased and evidence-based viewpoint
EducationLiteracy dataset from Lock5
Each row = case & Each column = variable
Kidney cancer
Counties with the highest kidney cancer rates
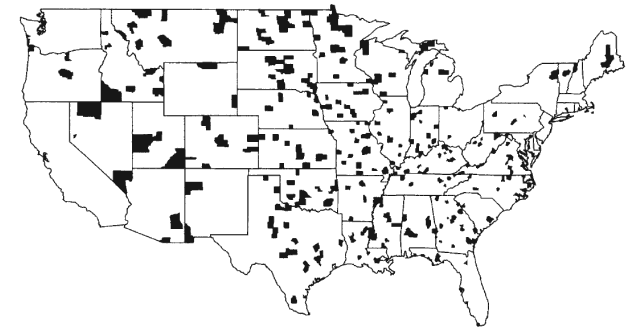
Source: Gelman et. al. Bayesian Data Anaylsis, CRC Press, 2004
Explanatory and Response Variable
When one variable helps us understand or predict values of another variable, we call the former the explanatory variable and the latter the response variable
Does meditation help reduce stress?
- explanatory variable: meditation
- response variable: stress level
Does sugar consumption increase hyperactivity?
- explanatory variable: sugar consumption
- response variable: hyperactive behavior
Group Activity 1

- Say hi to your neighbor
- Make a course folder called
stat120either on your Maize account or on your local computer - Please download the Class-Activity-1 template from moodle and go to class helper web page
10:00