Understanding Confidence Intervals and Bootstrap
STAT 120
Confidence Interval Recap
A confidence interval for a parameter is an interval computed from sample data by a method that will capture the parameter for a specified proportion of all samples.
\[CI = PE \pm ME\] 95 % CI \[ statistic \pm 2\times SE \]
Confidence level analogy and recap
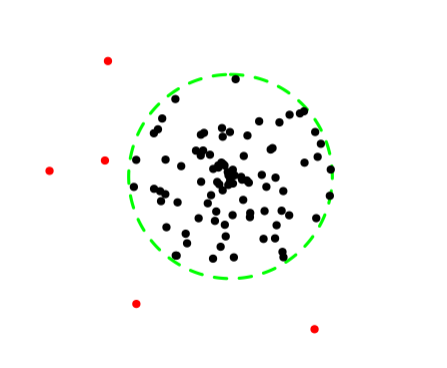
Shooting Arrows:
Bow’s confidence level determines accuracy.
A “95% confident” bow:
- 95 arrows hit inside the bulls eye out of 100
- 5 arrows miss
Single Shot Principle:
- Each arrow either hits or misses.
- No in-between or partial accuracy.
Conceptual Understanding: Repeated Sampling
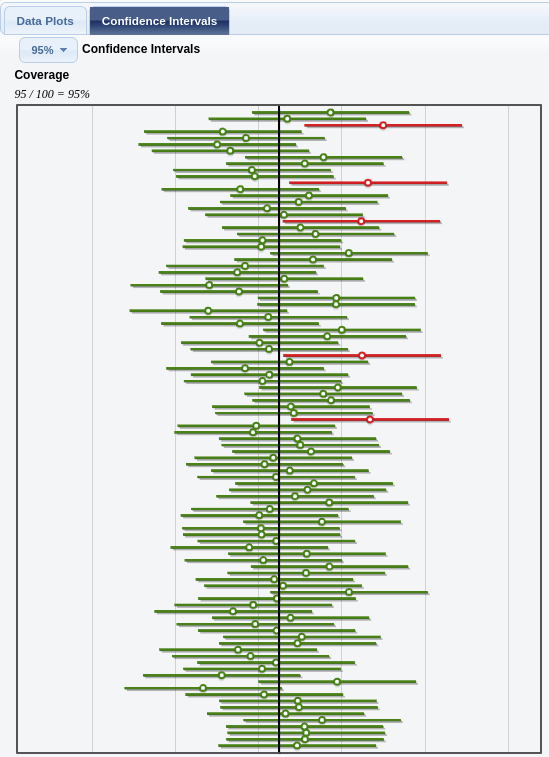
- The success rate (proportion of all samples whose intervals contain the parameter) is known as the confidence level
- A 95% confidence interval will contain the true parameter for 95% of all samples
Example 1
A survey of 1,502 Americans in January 2012 found that 86% consider the economy a “top priority” for the president and congress. The standard error for this statistic is 0.01.
What is the 95% confidence interval for the true proportion of all Americans that considered the economy a “top priority” at that time?
(1). (0.85, 0.87)
(2). (0.84, 0.88)
(3). (0.82, 0.90)
Click for answer
The correct answer is (2).Click here for the link
Confidence Interval Interpretation
Which of the following is an appropriate interpretation for a 95% confidence interval:
A. “we are 95% sure the interval contains the parameter”
B. “there is a 95% chance the interval contains the parameter”
C. Both A and B
D. Neither A nor B
Click for answer
The correct answer is A.Common Misintepretations
- Misinterpretation 1: “A 95% confidence interval contains 95% of the data in the population”
- Misinterpretation 2: “I am 95% sure that the mean of a sample will fall within a 95% confidence interval for the mean”
- Misinterpretation 3: “The probability that the population parameter is in this particular 95% confidence interval is 0.95”
- Correct: I am 95% sure that the mean of a population will fall within a 95% confidence interval for the mean
Example 2
A 98% confidence interval for mean pulse rate is 65 to 71. The interpretation “I am 98% sure that all students will have pulse rates between 65 and 71.” is
A. Correct
B. Incorrect
Click for answer
The correct answer is B.Example 3
A 98% confidence interval for mean pulse rate is 65 to 71. The interpretation “I am 98% sure that the mean pulse rate for this sample of students will fall between 65 and 71” is
A. Correct
B. Incorrect
Click for answer
The correct answer is B.Example 4
A 98% confidence interval for mean pulse rate is 65 to 71. The interpretation “I am 98% sure that the mean pulse rate for the population of all students will fall between 65 and 71” is
A. Correct
B. Incorrect
Click for answer
The correct answer is A.Level of Confidence
Which is wider? a 99% confidence interval or a 95% confidence interval?
95% CI
99% CI
Click for answer
The correct answer is (b). We need a larger interval (range of likely parameter values) to have more confidence.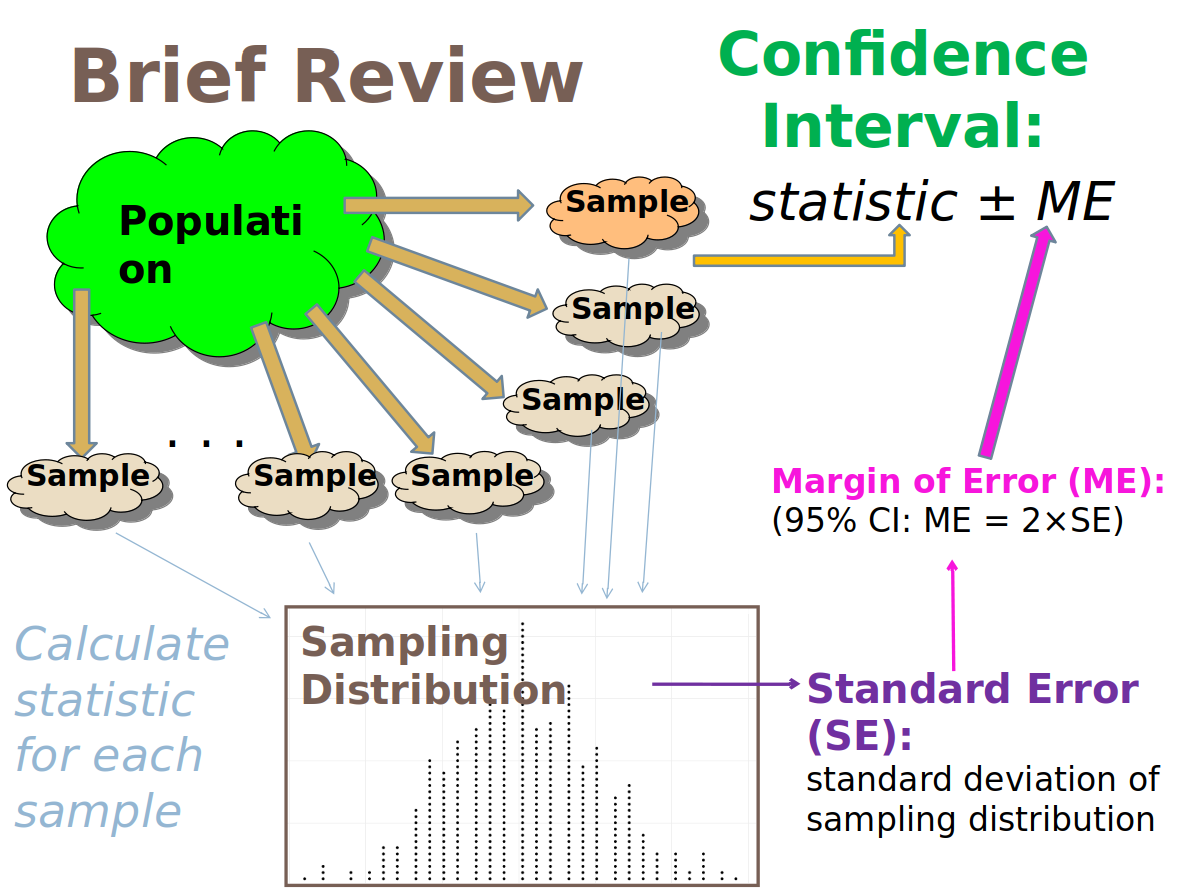
Recap: Sampling Distribution Vs Bootstrap Distribution
Sampling Distribution of a statistic
- Take many samples from the population, compute the statistic for each sample
- Shape: bell-shaped when n is large
- Center: population parameter
- Spread: called the SE of the statistic
Bootstrap Distribution of a statistic
- Take many bootstrap samples from the original sample, compute the statistic for each bootstrap sample
- Shape: bell-shaped when n is large
- Center: original sample statistic!
- Spread: called the bootstrap SE of the statistic
The standard errors from both approaches should be similar!!
Percentile Method Bootstrap
If the bootstrap distribution is approximately symmetric, a P% confidence interval equals the percentiles in the bootstrap distribution so that the proportion of bootstrap statistics between the percentiles equal P%.
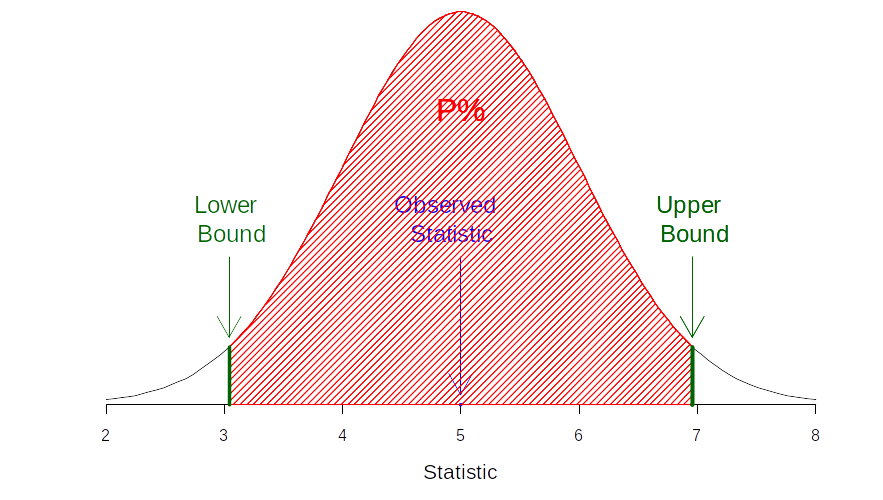
Percentiles of a bootstrap distribution
The Magic of Bootstrapping
- We can use bootstrapping to approximate the SE for many types of sample statistic!
- Mean, proportion, differences, correlation, slope
- Standard deviation, median
- What should the bootstrap distribution look like?
- “smooth” (i.e. not a lot of spikey-ness)
- If using \(95\% ME = 2SE\), should be symmetric and bell-shaped.
Mercury and pH in Lakes
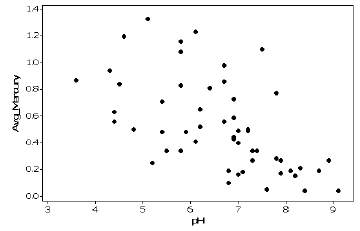
For Florida lakes, what is the correlation between average mercury level (ppm) in fish taken from a lake and acidity (pH) of the lake?
Lange, Royals, and Connor, Transactions of the American Fisheries Society (1993)
Mercury and pH in Lakes (Statkey)
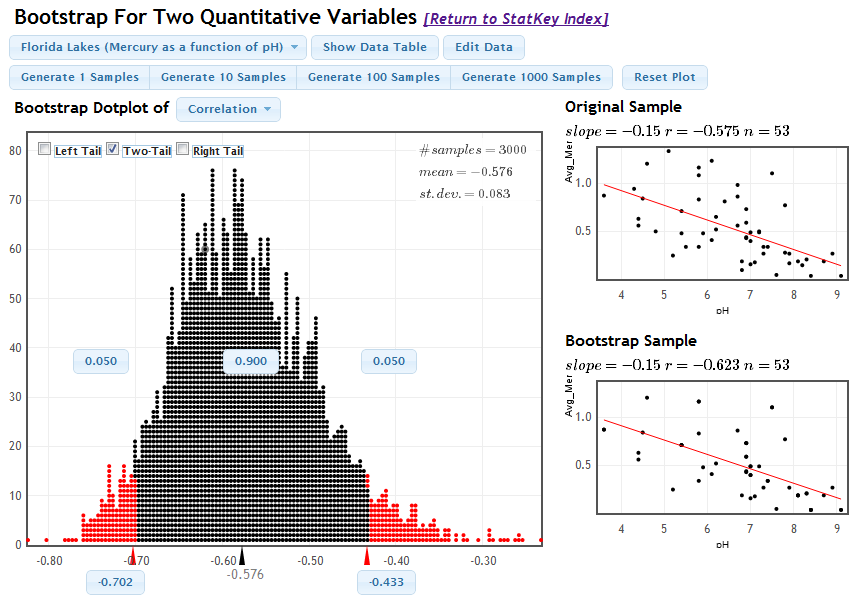
Bootstrapping correlation parameter.
We are 90% confident that the true correlation between average mercury level and pH of Florida lakes is between -0.702 and -0.433.
Group Activity 1

- Please download the Class-Activity-10 template from moodle and go to class helper web page
30:00
