Statistical Hypothesis Testing
STAT 120
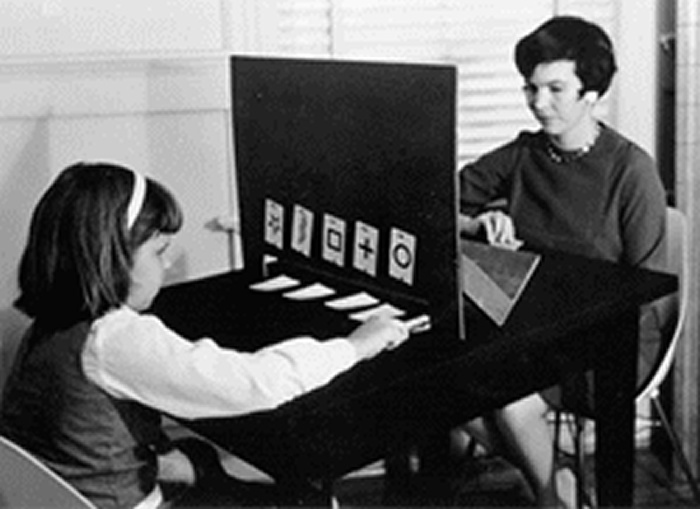
Another Motivating Example: Extrasensory Perception
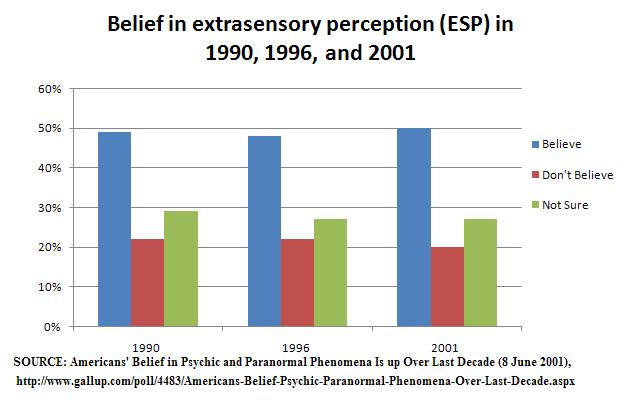
Extrasensory Perception

Group Activity 1

- Please download the Class-Activity-11 template from moodle and go to class helper web page and complete Problem 1
10:00
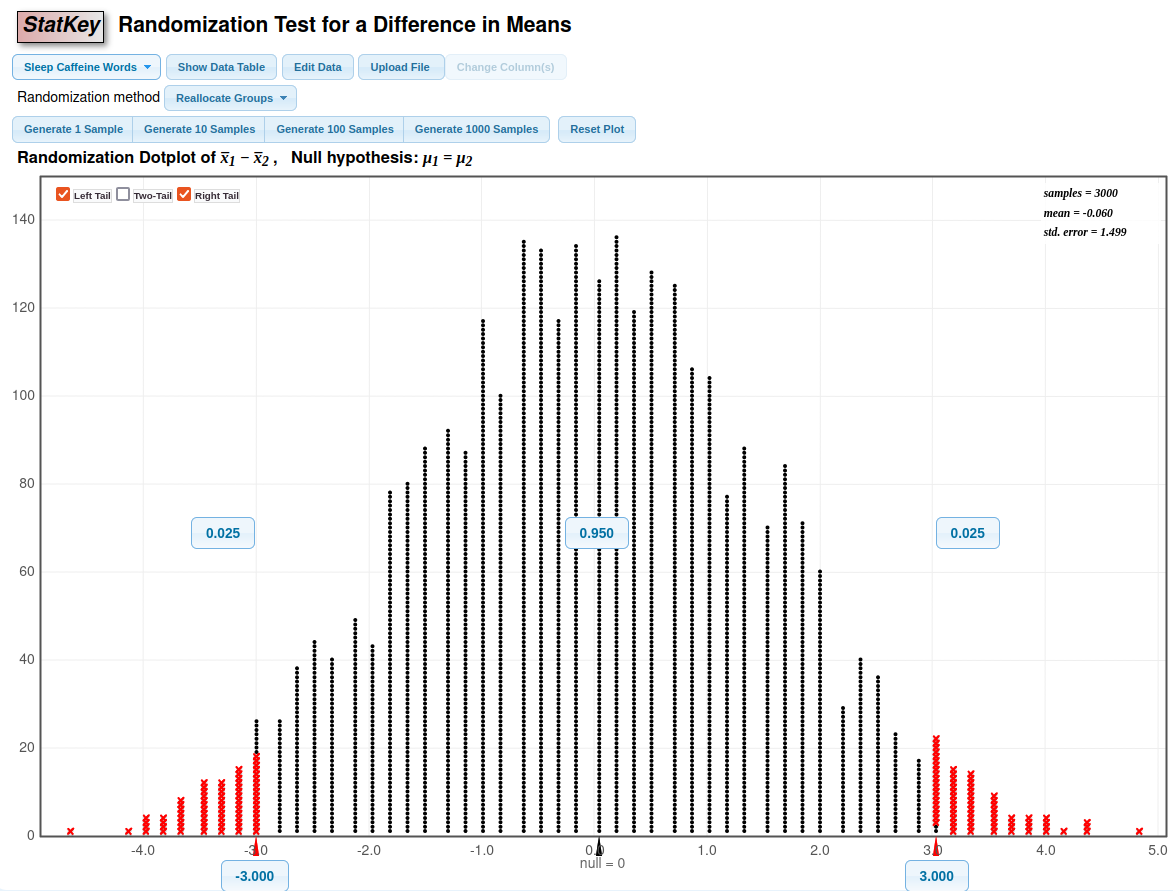
Random chance using Statkey
How can we be sure if an observed difference between two groups is real, or if it’s just something that could happen by random chance?
Group Activity 2
- Finish the rest of the class activity and submit to moodle when done.
20:00