The Normal Distribution!

STAT 120

Bastola

Overview

Core intro stats covered: EDA for data comprehension, estimation with confidence, and hypothesis testing via p-values.

Upcoming focus: Advanced inference methods, transitioning from simulations to probability models for bootstrap/randomization distributions.

Density Curve

A density curve is a theoretical model to describe a distribution.

Distribution for

  • individual measurements in population (for a quantitative variable)
  • Sampling distribution for a statistic

All density curves have an area under the curve of 1 (100%)

  • give proportions/percents as areas under the curve

Normal Distribution

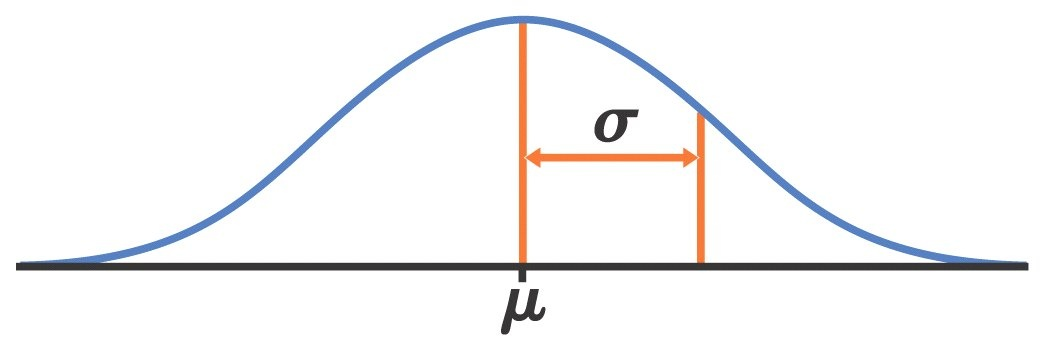
A normal distribution has a symmetric bell-shaped density curve.

The Normal Model: \(X \sim N(\mu, \sigma)\)

The mean and SD determine how a normal density curve looks. The normal model parameters are

  • \(\mu\) = model mean (center)
  • \(\sigma=\) model SD (variability)

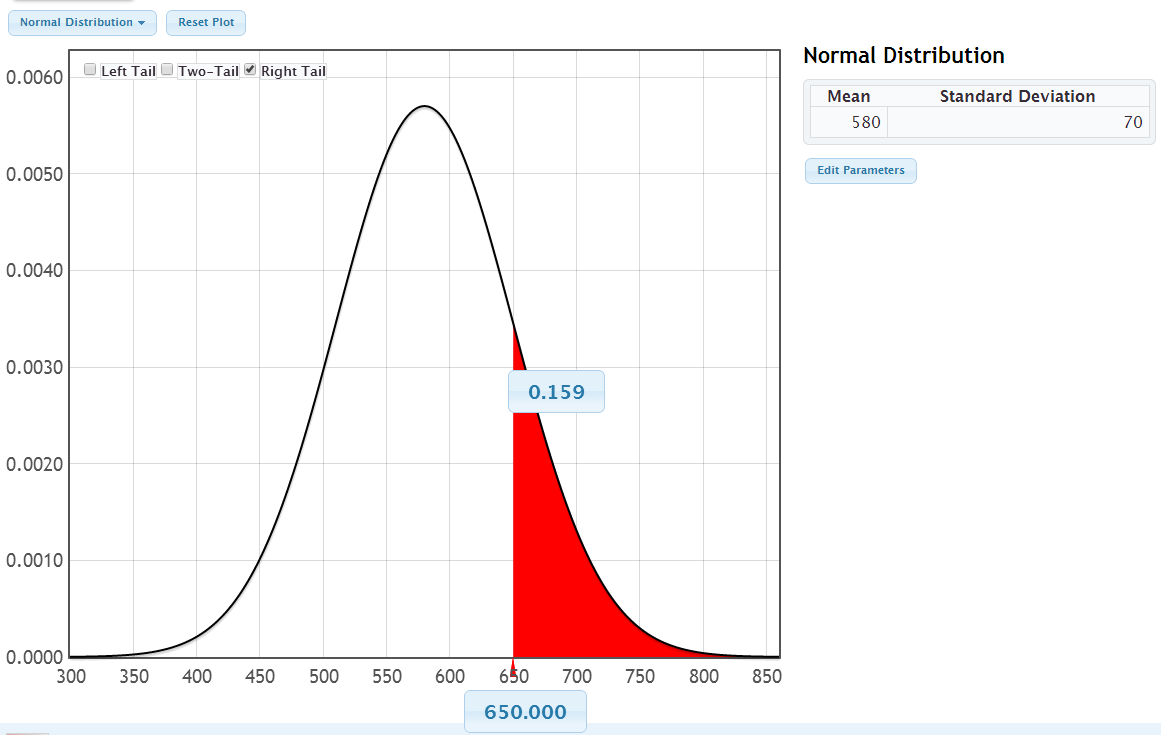
Verbal SAT \(\sim N(580,70)\)

What proportion of people score above 650?

How can we find areas under a normal density?

  • The curve represents the normal distribution, denoted by \(N(\mu, \sigma)\).
  • (CALCULUS!!) Calculating the exact area requires integration, as given by the formula: Area \(=\int_a^b \frac{1}{\sqrt{2 \pi \sigma}} e^{-\frac{(x-\mu)^2}{2 \sigma^2}} d x\)
  • We’ll just utilize technological tools.

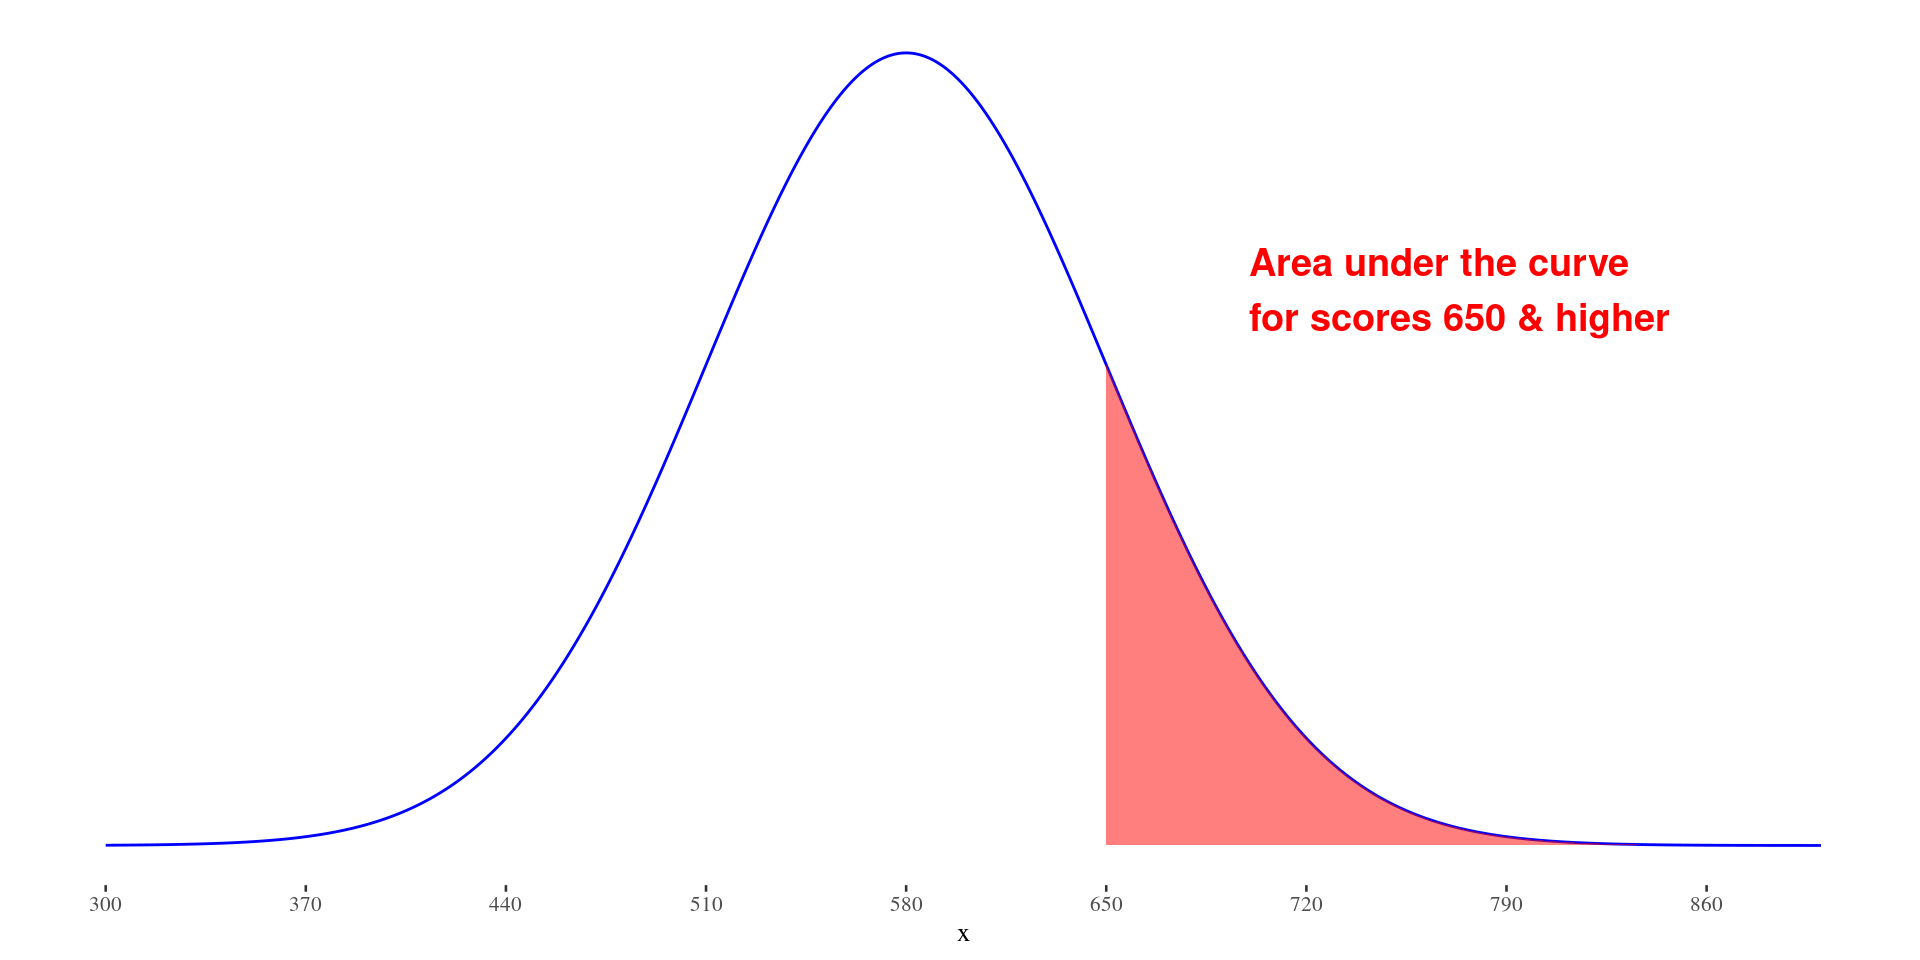
StatKey – Verbal SAT: What proportion of people score above 650?


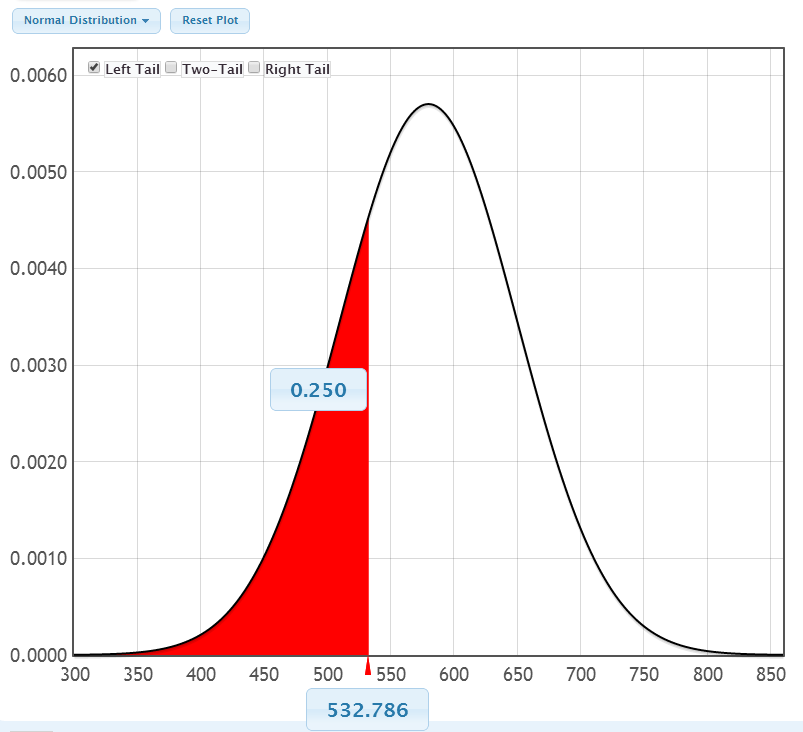
StatKey – Some observations 1


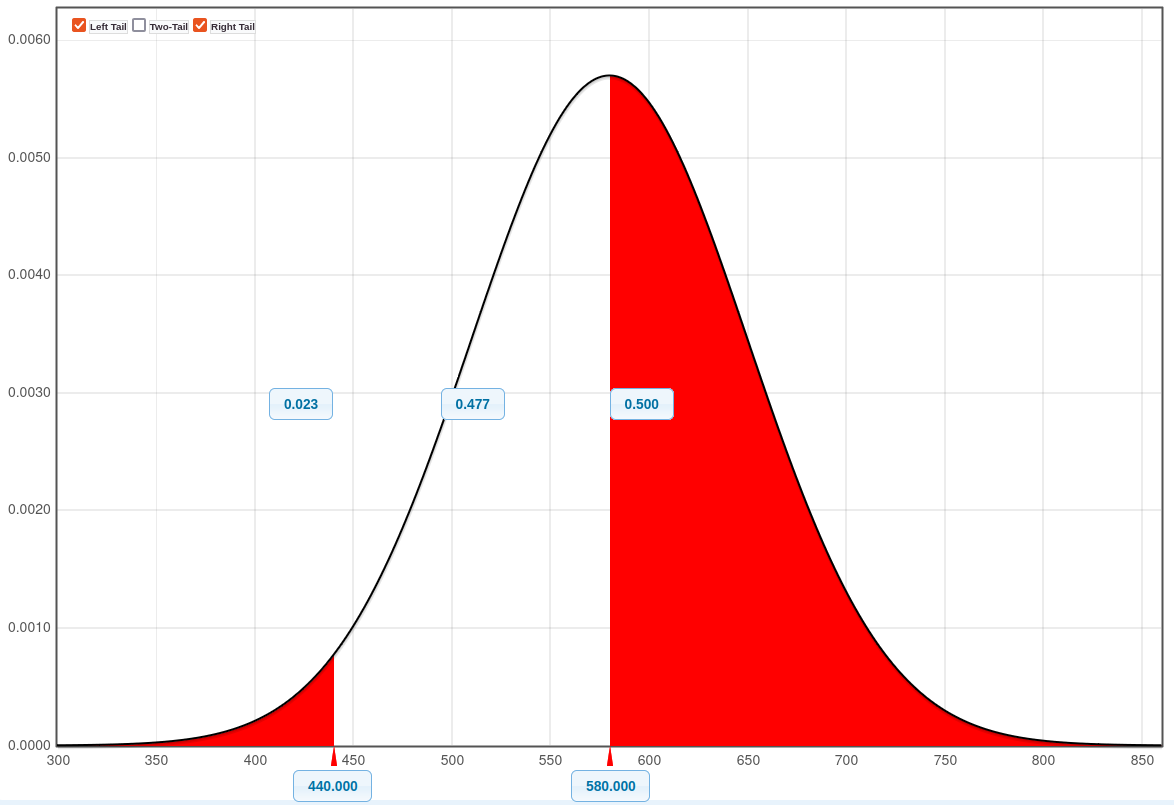
StatKey – Some observations 2


Example: Verbal SAT scores Using R

What percent of the population scored 650 or higher?

# 1 - left-tail-area
1 - pnorm(650, 580,70)
[1] 0.1586553
# right-tail-area
pnorm(650, 580,70, lower.tail = FALSE) # alternate method
[1] 0.1586553

What score is the \(25^{th}\) percentile?

# qnorm(left-quantile, mean, sd)
qnorm(.25,580,70)
[1] 532.7857

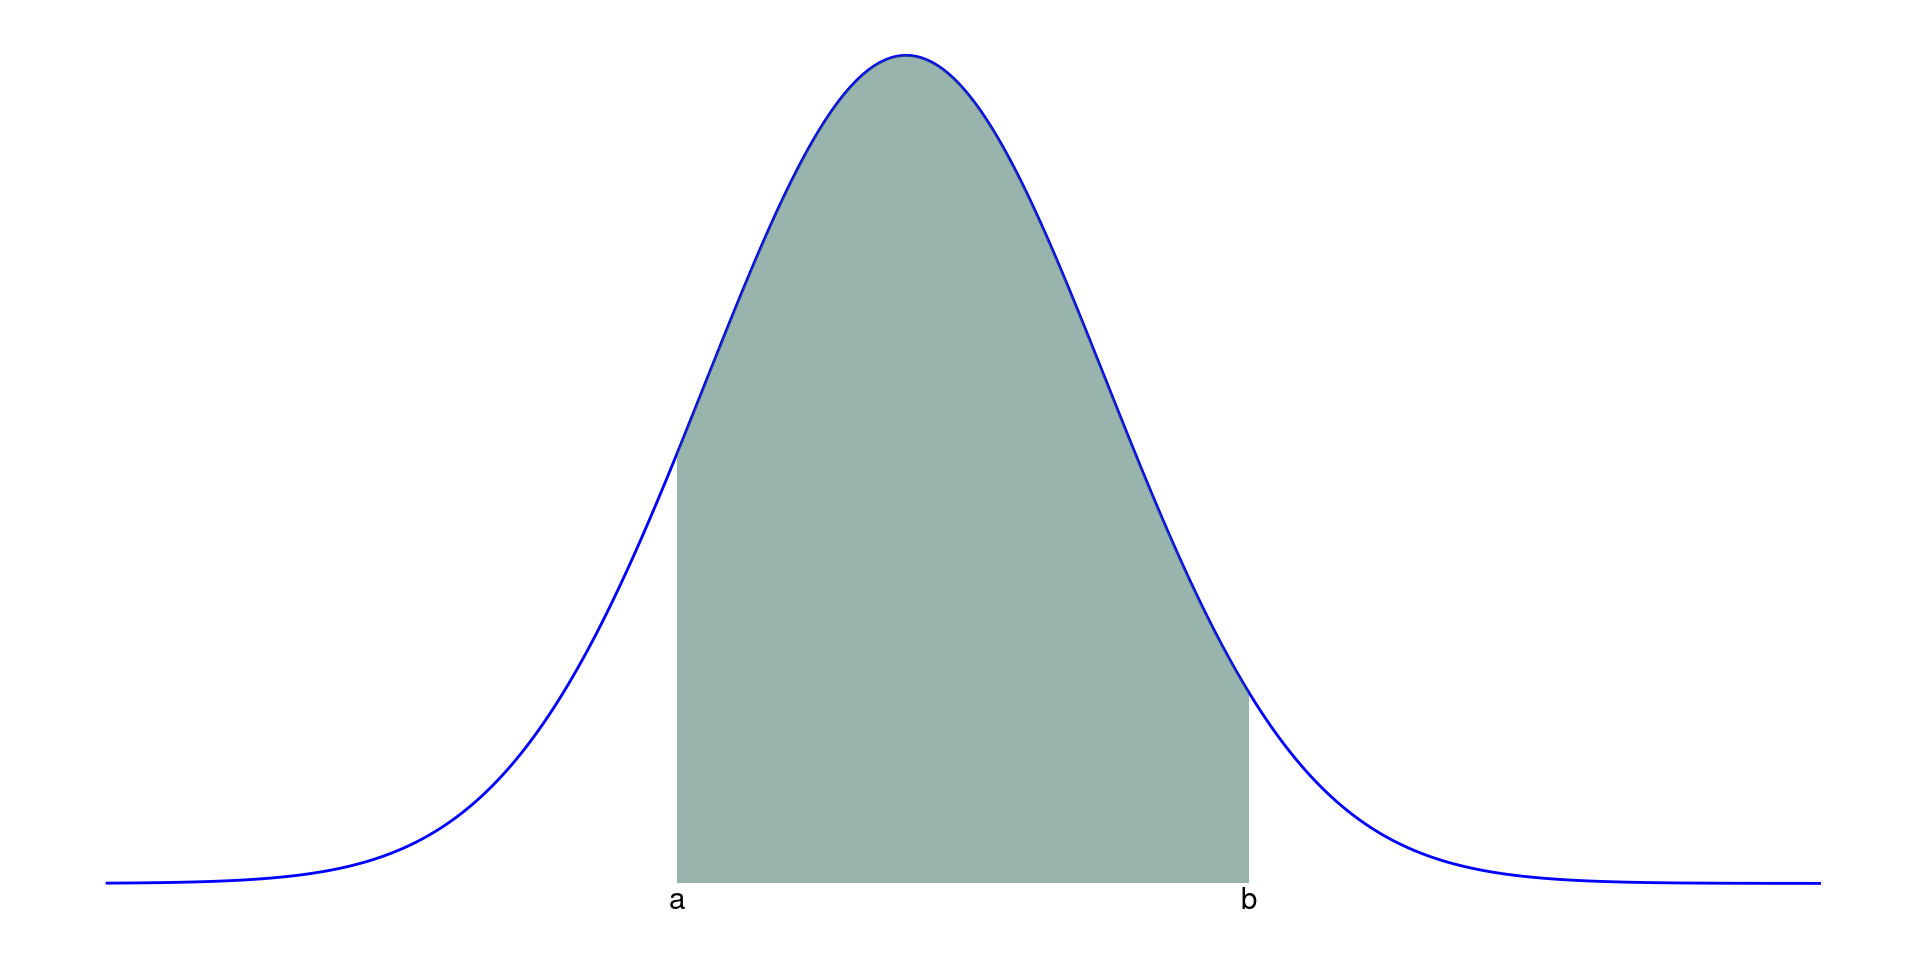
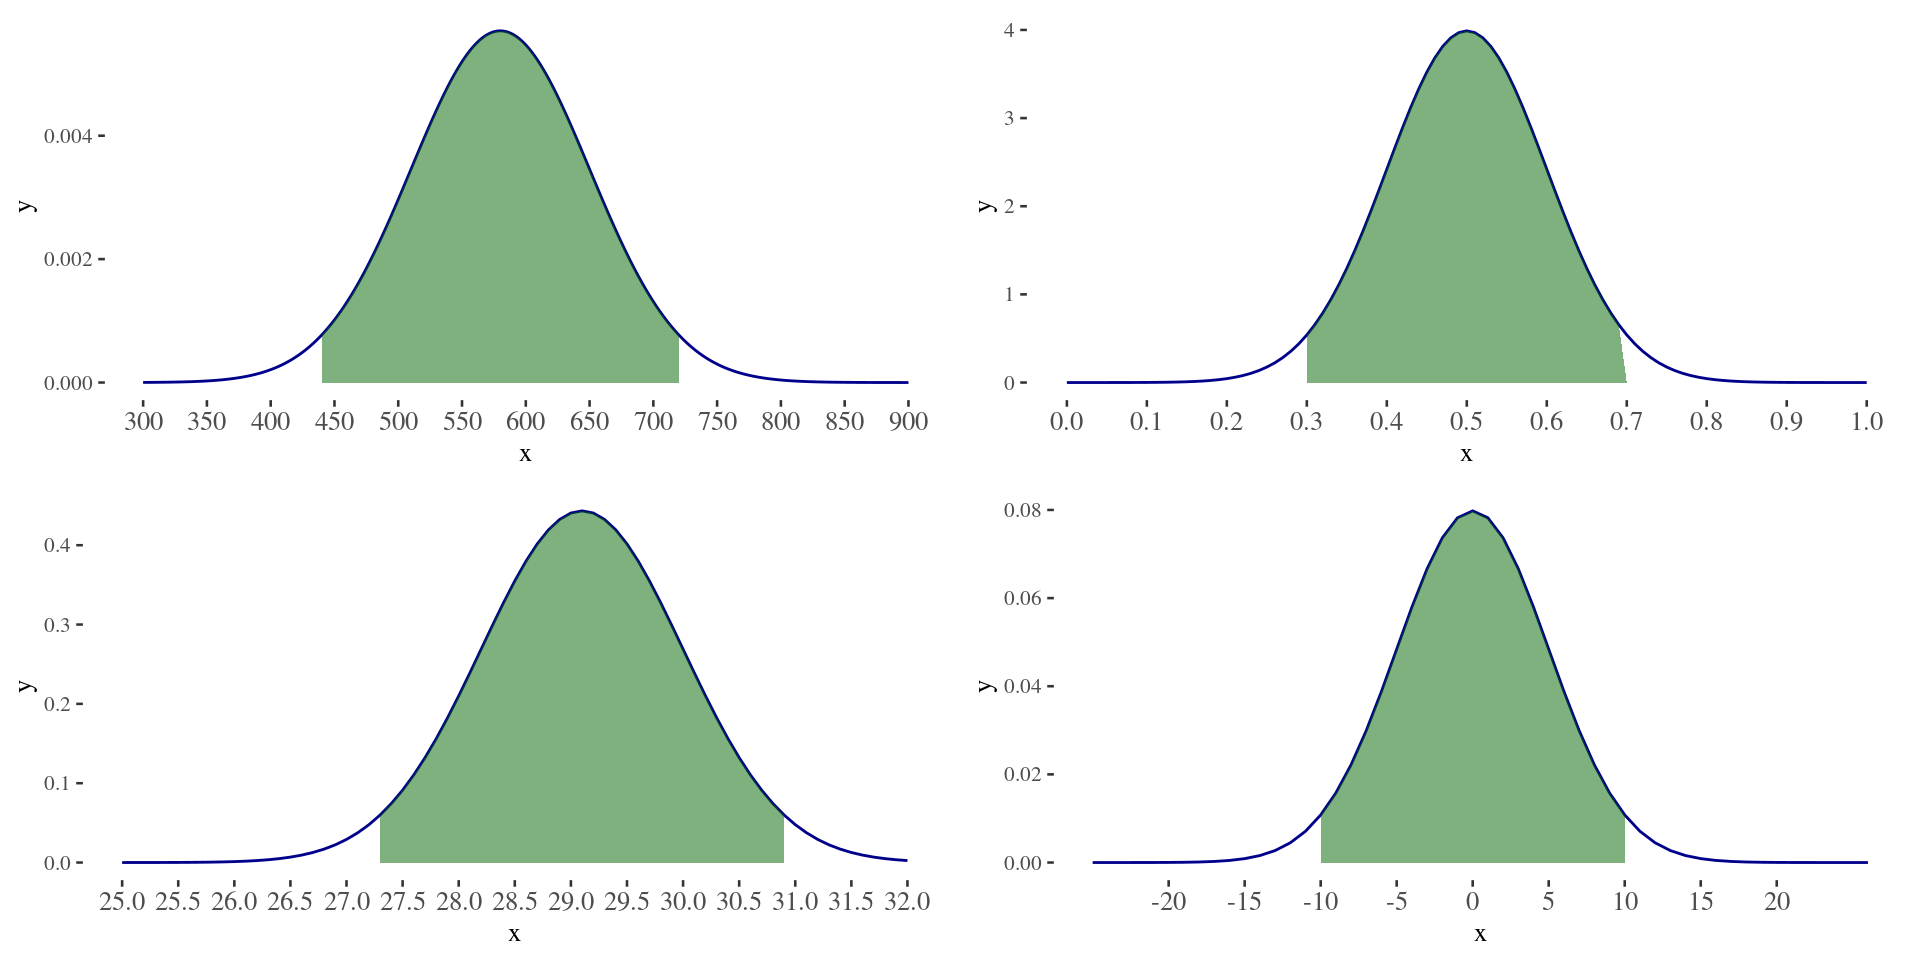
What is common in all 4 figures?

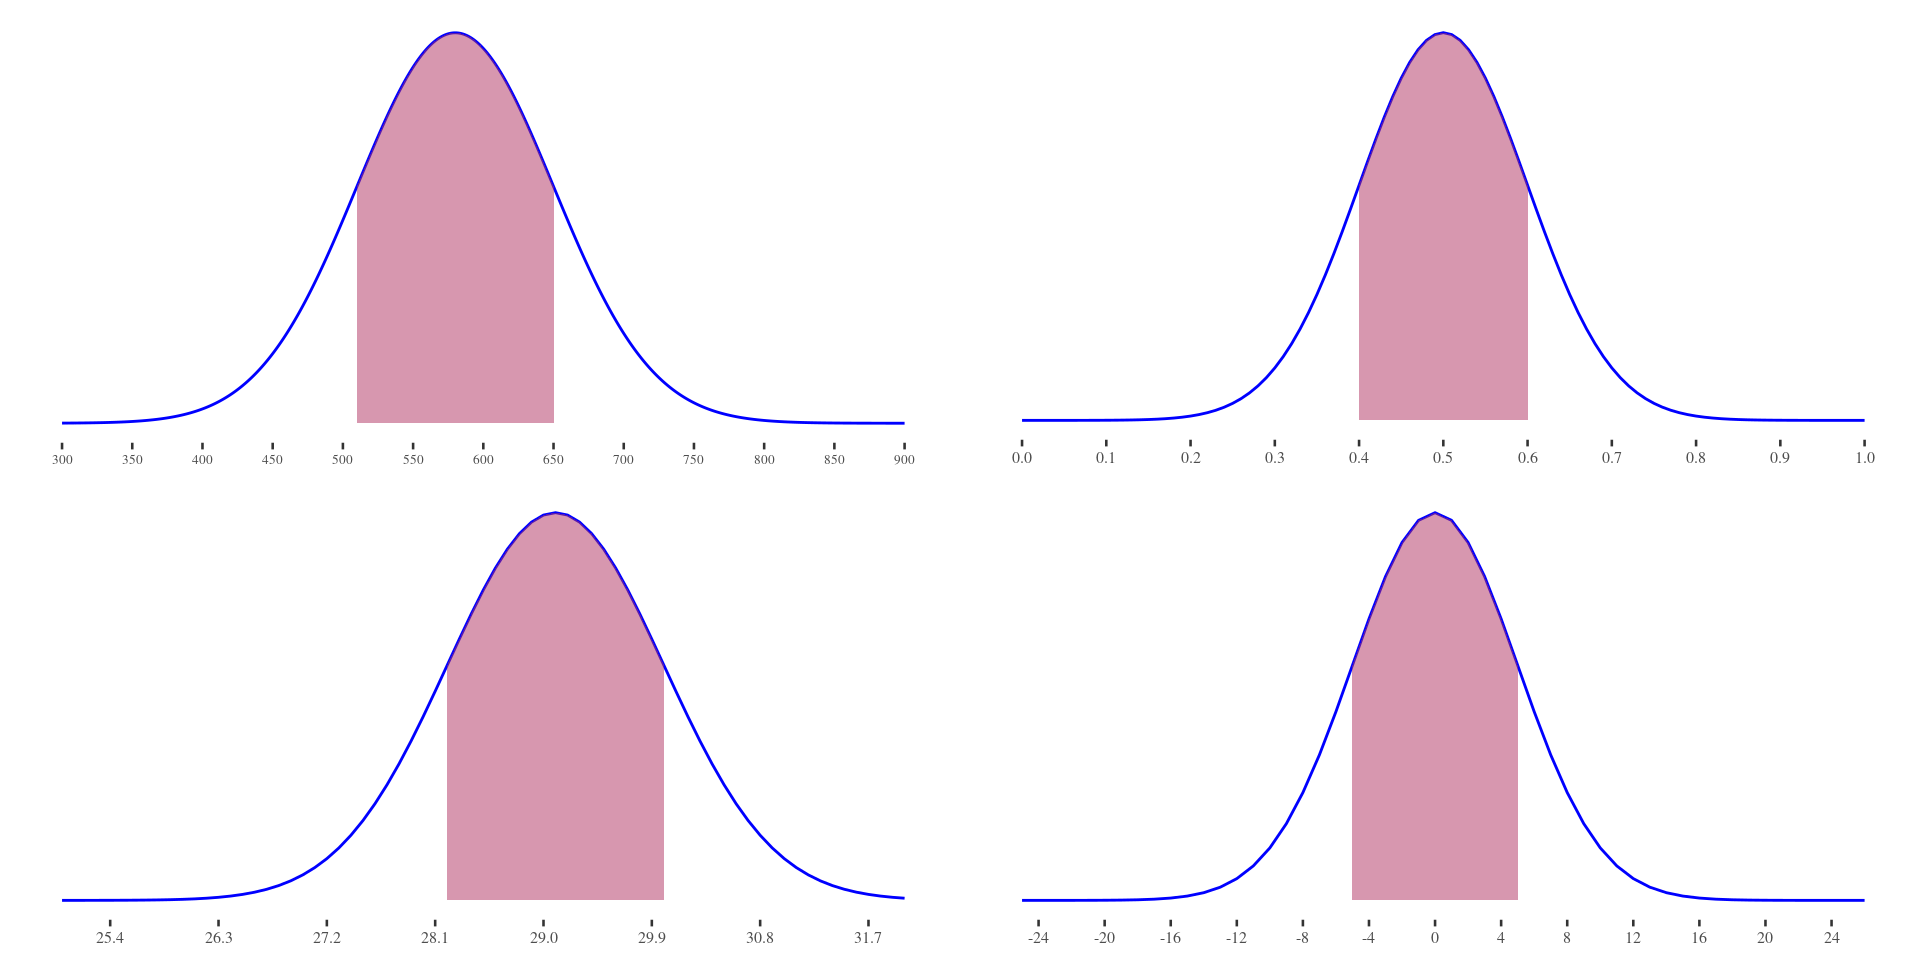
What is common in all these 4 figures?

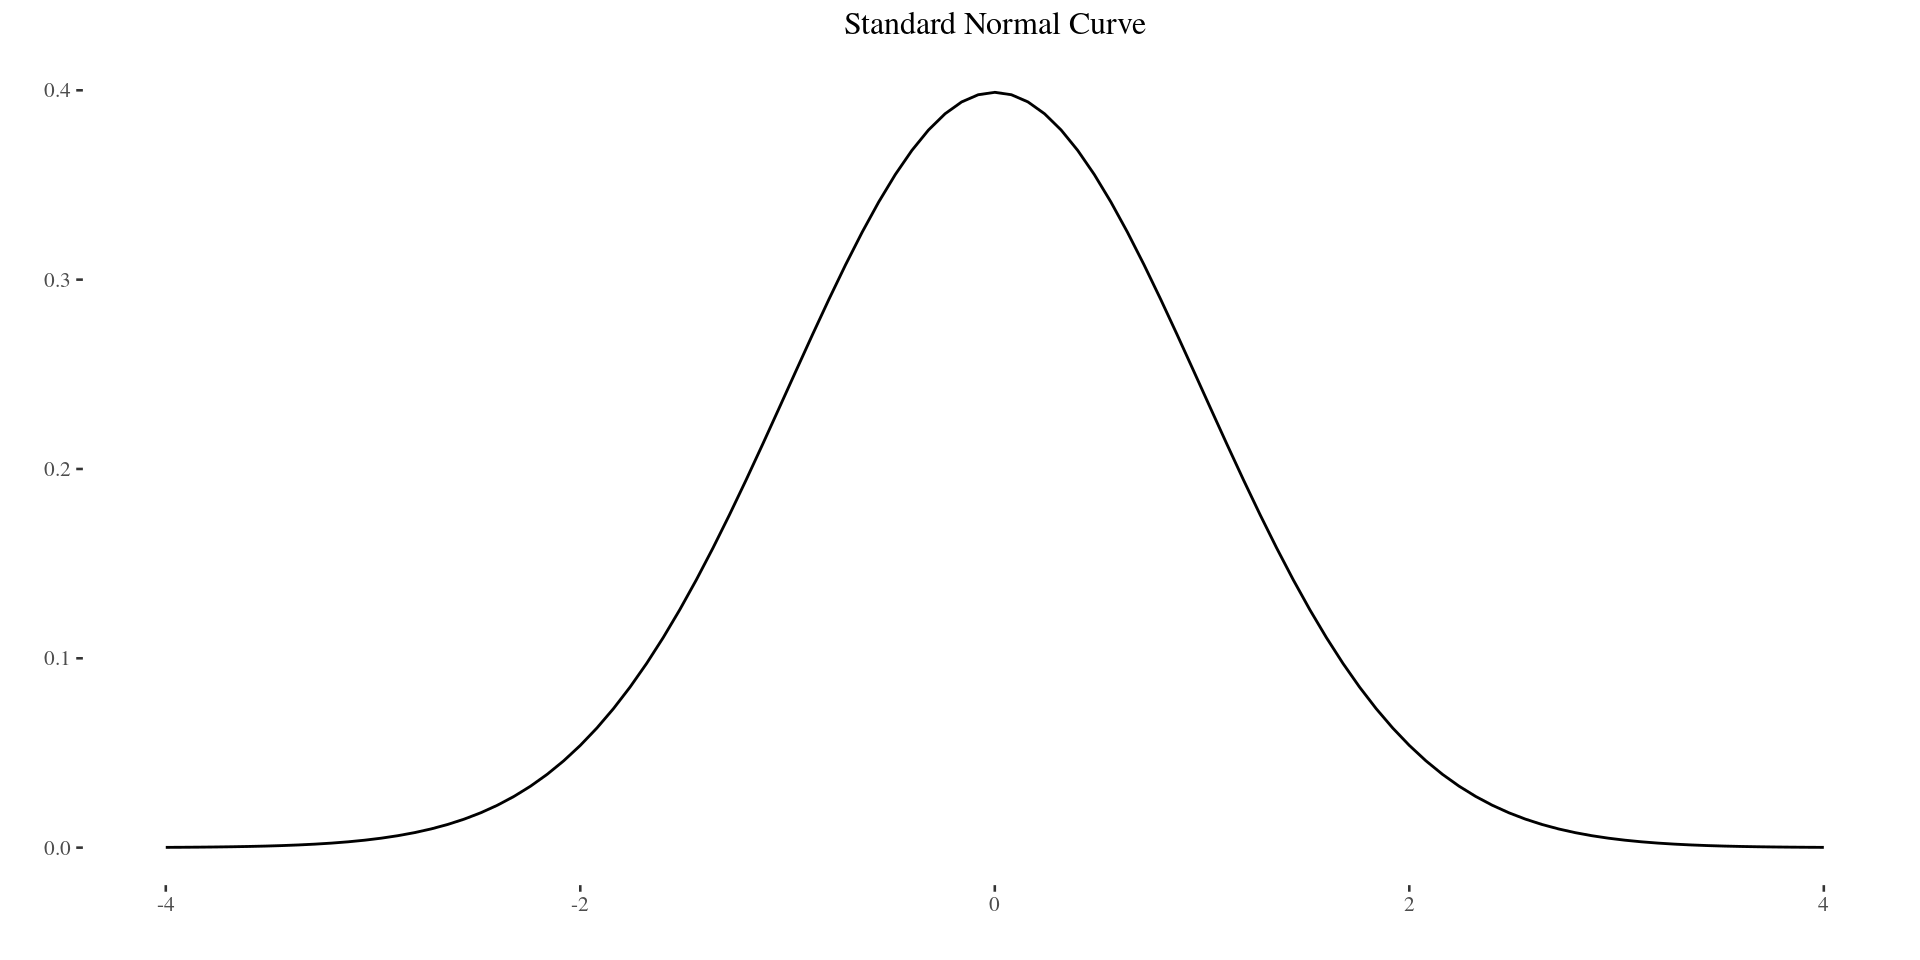
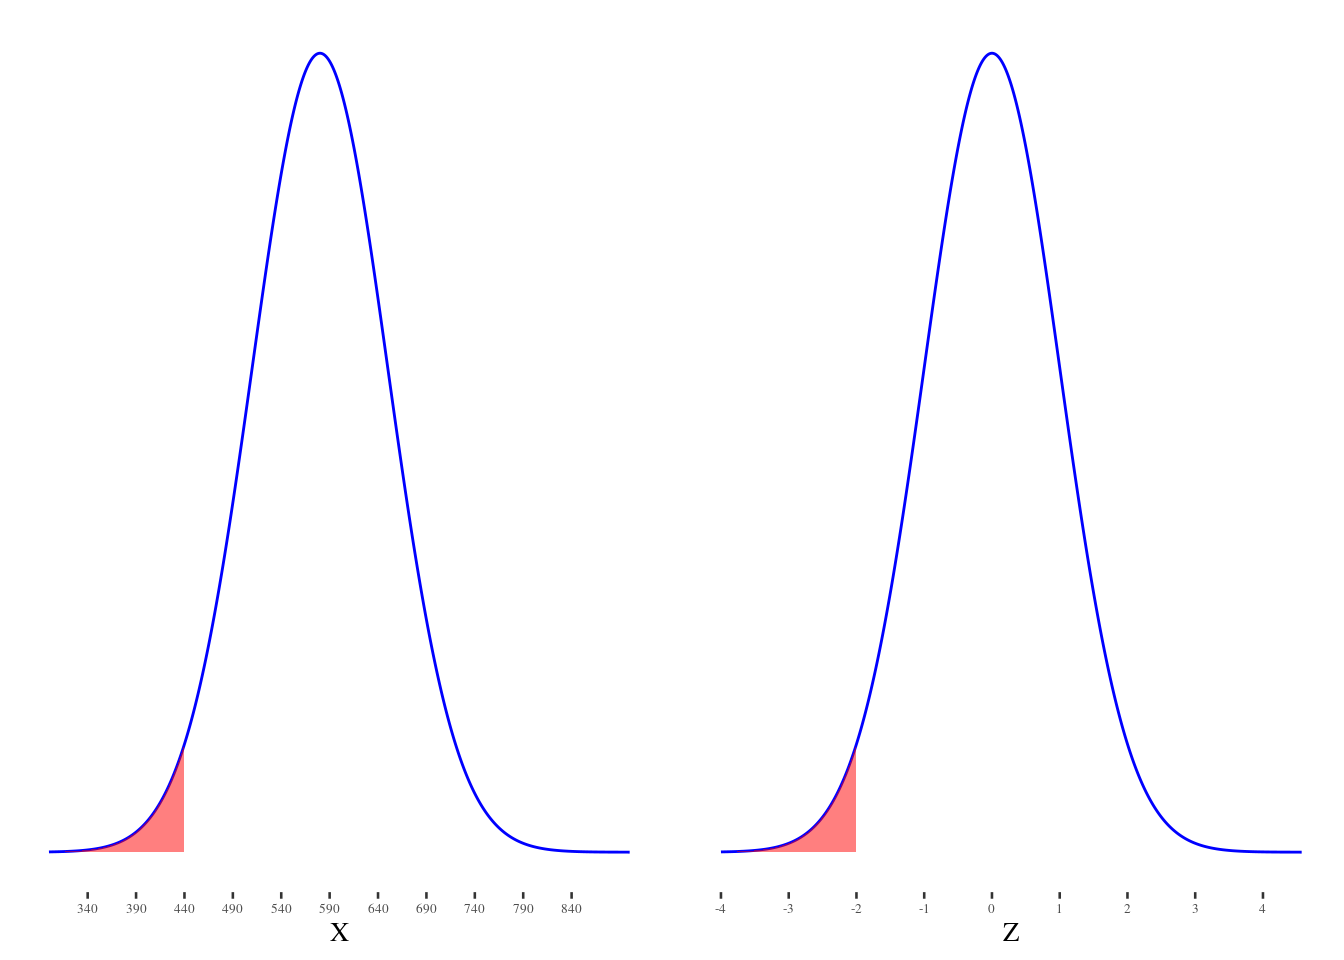
Connecting any Normal model to the standard normal model

Area below x = Area below z

Big picture

When have we already been using normal models??

  • Bootstrap distributions – get confidence intervals if a bootstrap distribution is roughly bell-shaped
  • Randomization distributions – many of these are bell-shaped.
  • Normal models play a huge role in statistical inference.
  • If we know the (bootstrap/randomization) standard error then we can just use a normal model rather than a resampling model (which requires more computational effort)

 Group Activity 1


30:00