[1] -3.333333Inference for Two Proportions
STAT 120
Bastola
One Proportion or Two?
You want to…
… compare the proportion of students who use a Windows-based PC to the proportion who use a Mac.
Inference for one proportion
Inference for two proportions
Click for answer
The correct answer is a. This is one categorical variable: type of computer usedOne Proportion or Two?
You want to…
… compare the proportion of students who study abroad between those attending public universities and those at private universities.
Inference for one proportion
Inference for two proportions
Click for answer
The correct answer is b. This is two categorical variables: study abroad or not, and public or private universityOne Proportion or Two?
You want to…
… compare the proportion of in-state students at a university to the proportion from outside the state.
Inference for one proportion
Inference for two proportions
Click for answer
The correct answer is a. This is one categorical variable: in-state or out-of-state
One Proportion or Two?
You want to…
… compare the proportion of in-state students who get financial aid to the proportion of out-of-state students who get financial aid
This is…
Inference for one proportion
Inference for two proportions
Click for answer
The correct answer is b. This is two categorical variables: in-state or out-of-state, and financial aid or notTagging Penguins
Are metal tags detrimental to penguins? A study looked at the 10 year survival rate of penguins tagged either with a metal tag or an electronic tag. 20% of the 167 metal tagged penguins survived, compared to 36% of the 189 electronic tagged penguins.
Is there a statistically discernible difference in survival rates? \[\begin{align*} H_0: p_M=p_E \quad H_A: p_M \neq p_E \end{align*}\] \(p=\) true survival rate

Source: Saraux, et. al. (2011). “Reliability of flipper-banded penguins as indicators of climate change,” Nature, 469, 203-206.
Tagging Penguins
20% of the 167 metal tagged penguins survived, compared to 36% of the 189 electronic tagged penguins.
| Survived | Died | Total | |
|---|---|---|---|
| Metal Tag | 33 | 134 | 167 |
| Electronic Tag | 68 | 121 | 189 |
| Total | 101 | 255 | 356 |
Are the conditions met for using the normal distribution for inference?
a). Yes
b). No
Click for answer
The correct answer is a. With metal tags, 33 survived and 134 died. With electronic tags, 68 survived and 121 died. All counts are greater than 10.Pooled Proportion
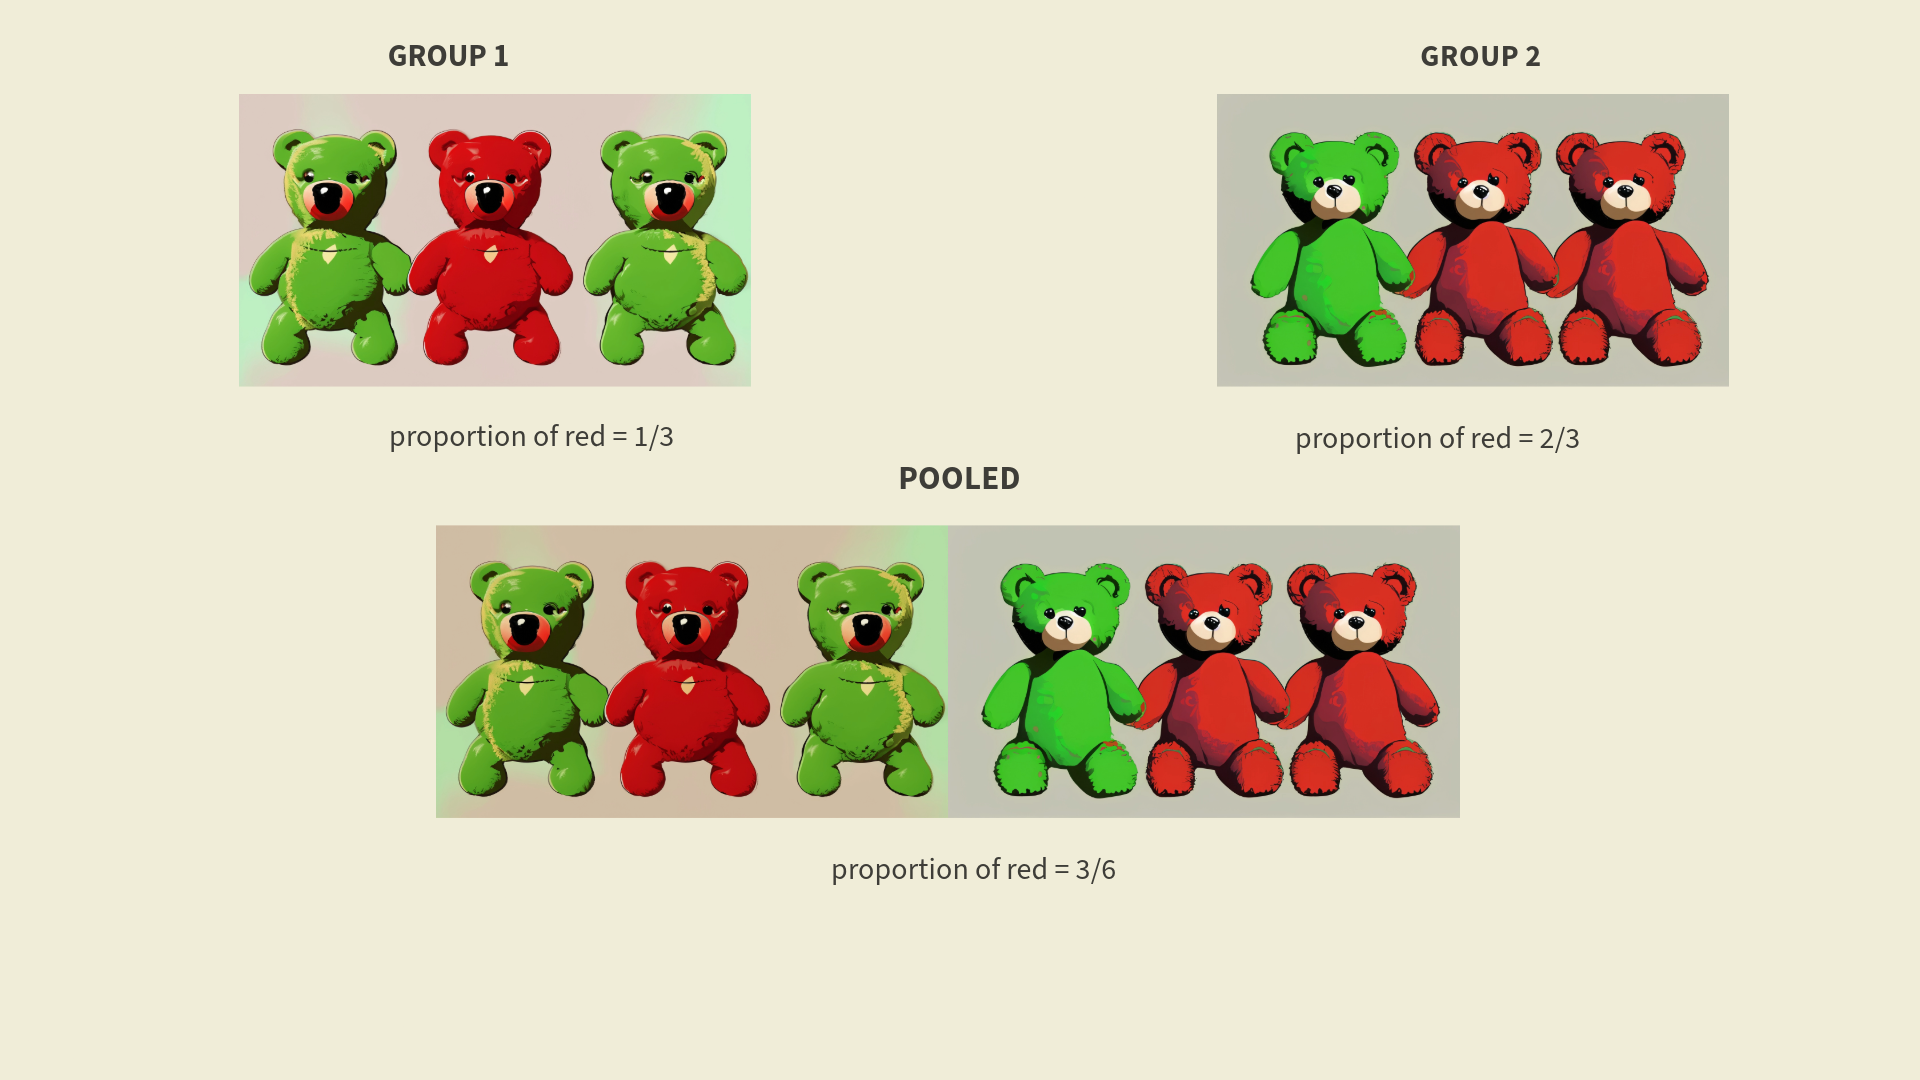
Pooling is done to combine the data from both groups and come
up with a combined proportion, assuming the groups are the same
Pooled Proportion
We don’t know \(\mathrm{p}_{\mathrm{M}}\) or \(\mathrm{p}_{\mathrm{E}}\), so how do we compute the SE for our hypothesis test?
- Assume the two proportions are equal and use .b[one proportion for both groups.
- Our best guess of this one proportion comes from combining data from both groups and computing the overall proportion, called the pooled proportion p.
- Hint: the pooled proportion will always be somewhere in between the two sample proportions.
Inference Using \(\mathrm{N}(0,1)\)
If the distribution of the sample statistic is normal: A confidence interval can be calculated by \[\begin{align*} \text { sample statistic } \pm z^* \times S E \end{align*}\] where \(z^*\) is a \(N(0,1)\) percentile depending on the level of confidence. A p-value is the area in the tail(s) of a \(N(0,1)\) beyond \[\begin{align*} z=\frac{\text { sample statistic }- \text { null value }}{\text { SE }} \end{align*}\]
Test for a Difference in Proportions
\[\begin{align*} H_0: p_1&=p_2\\ H_a: p_1&\neq p_2 \end{align*}\]
\[\begin{align*} \hat{p}_{pooled}=\frac{33+68}{167+189}=0.2837 \end{align*}\]
\[z=\frac{\left(\hat{p}_1-\hat{p}_2\right)-0}{\sqrt{\frac{\hat{p}_{pooled}(1-\hat{p}_{pooled})}{n_1}+\frac{\hat{p}_{pooled}(1-\hat{p}_{pooled})}{n_2}}}\]
If observed counts in the two-way table are at least 10, then the \(p\)-value can be computed as the area in the tail(s) of a standard normal beyond \(z\). .out-t[Always use pooled proportion for the SE.
Tagging Penguins
20% of the 167 metal tagged penguins survived, compared to 36% of the 189 electronic tagged penguins.
33 survived with metal tags and 68 with electronic The pooled proportion is: \[\begin{align*} \hat{p}_{pooled}=\frac{33+68}{167+189}=0.2837 \end{align*}\]
SE for our test: \[\begin{align*} S E=\sqrt{\frac{0.284(1-.284)}{167}+\frac{0.284(1-.284)}{189}}=0.048 \end{align*}\]
Tagging Penguins
Tagging Penguins
A difference in survival rates as extreme, or more extreme, than \(16 \%\) would occur by chance only about \(0.08 \%\) of the time. There is a statistically discernible difference \((\mathrm{z}=-3.34, \mathrm{p}=0.0008)\)
How much do the rates differ? - Compute a \(95 \%\) CI for the difference…
How do we compute the SE? - We can’t use the pooled version since we’ve concluded the proportions differ!
Confidence Interval for \(p_1-p_2\)
For large enough \(\mathrm{n}_1\) and \(\mathrm{n}_2\) : \(\quad\) statistic \(\pm \quad z^* \times S E\)
\[\left(\hat{p}_1-\hat{p}_2\right) \pm z^* \sqrt{\frac{\hat{p}_1\left(1-\hat{p}_1\right)}{n_1}+\frac{\hat{p}_2\left(1-\hat{p}_2\right)}{n_2}}\]
Metal Tags and Penguins
\(20 \%\) of the 167 metal tagged penguins survived, compared to \(36 \%\) of the 189 electronic tagged penguins. Give a \(90 \%\) confidence interval for the difference in proportions (metal - electronic).
What is \(\mathrm{z}^*\) for the confidence interval?
1.280
1.645
1.960
2.575
0.90
Tagging Penguins: 90% C.I
\(20 \%\) of the 167 metal tagged penguins survived, compared to \(36 \%\) of the 189 electronic tagged penguins. Give a \(90 \%\) confidence interval for the difference in proportions (metal - electronic).
\(90 \% C I\) for \(\mathrm{p}_M-\mathrm{p}_E:\)
\[\begin{align*} (0.2-0.36) &\pm 1.645 \cdot \sqrt{\frac{0.2(1-0.2)}{167}+\frac{0.36(1-0.36)}{189}}\\ &=-0.16 \pm 1.645 \times 0.047\\ &=(-0.237,-0.09) \end{align*}\]
We are \(90\%\) confident that the survival rate is between \(9%\) and \(23.7%\) lower for metal tagged penguins, as opposed to electronically tagged.
Metal Tags and Penguins
\(20 \%\) of the 167 metal tagged penguins survived, compared to \(36 \%\) of the 189 electronic tagged penguins. Give a \(95 \%\) confidence interval for the difference in proportions (metal - electronic).
What is \(\mathrm{z}^*\) for the confidence interval?
1.280
1.645
1.960
2.575
0.90
Tagging Penguins: 95% C.I
\(20 \%\) of the 167 metal tagged penguins survived, compared to \(36 \%\) of the 189 electronic tagged penguins. Give a \(95 \%\) confidence interval for the difference in proportions (metal - electronic).
\(95 \% C I\) for \(\mathrm{p}_M-\mathrm{p}_E:\)
\[\begin{align*} (0.20-0.36) &\pm 1.96 \sqrt{\frac{0.20 \times 0.80}{167}+\frac{0.36 \times 0.64}{189}}\\ &=-0.16 \pm 1.96 \times 0.047\\ &=(-0.251,-0.069) \end{align*}\]
We are \(95 \%\) confident that between \(6.9 \%\) to \(25.1 \%\) fewer penguins survive when metal tags are used compared to electronic tags.
Group Activity 1

- Please download the Class-Activity-18 template from moodle and go to class helper web page
30:00