| species | mean | sd | n |
|---|---|---|---|
| hedge.sparrow | 23.11429 | 1.0494373 | 14 |
| meadow.pipit | 22.29333 | 0.9195849 | 45 |
| pied.wagtail | 22.88667 | 1.0722917 | 15 |
| robin | 22.55625 | 0.6821229 | 16 |
| tree.pipit | 23.08000 | 0.8800974 | 15 |
| wren | 21.12000 | 0.7542262 | 15 |
Post-ANOVA
STAT 120
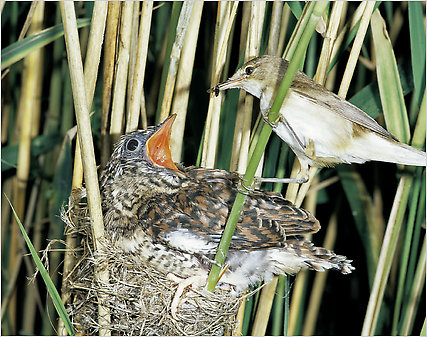
Cuckoo Birds
Cuckoo birds lay their eggs in the nests of other birds
When the cuckoo baby hatches, it kicks out all the original eggs/babies
If the cuckoo is lucky, the mother will raise the cuckoo as if it were her own
Do cuckoo bird eggs found in nests of different species differ in size?
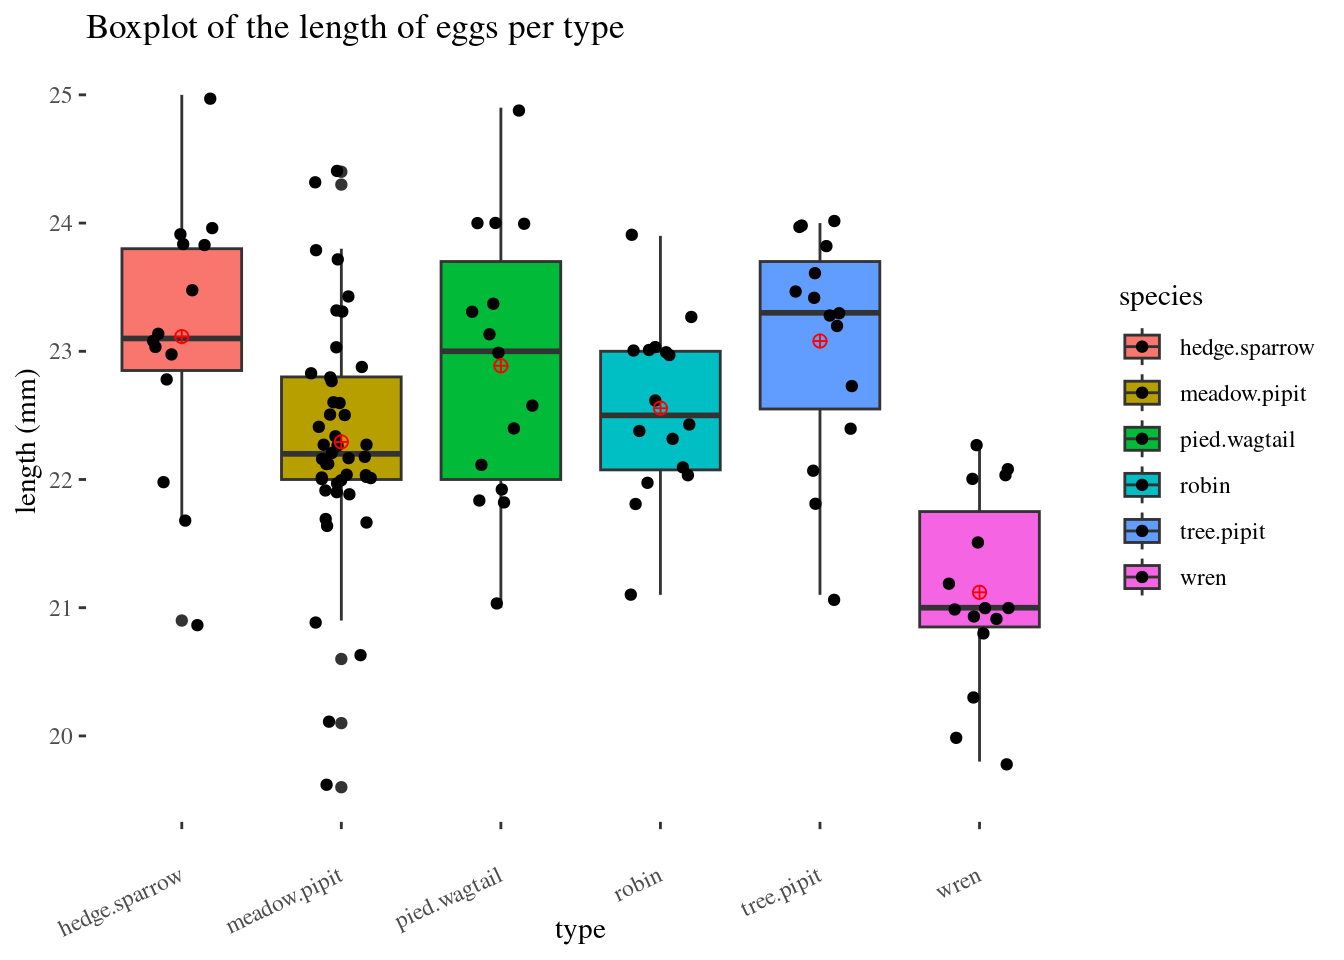
Side-by-side Boxplot
Cuckoo %>%
  ggplot(aes(x=species,y=length,fill=species)) +
  theme_bw() +
  geom_boxplot() +
  geom_jitter(width = 0.2) +
  labs(title ="Boxplot of the length of eggs per type",
       y = "length (mm)",
       x = "type") +
  stat_summary(fun=mean, geom="point", shape=10,
               size=2, color="red", fill="black") +
  ggthemes::theme_tufte() +
theme(axis.text.x = element_text(angle = 25, hjust = 1, vjust = 0.5)) Approximate normality in groups

Group Activity 1

- Please download the Class-Activity-25 template from moodle and go to class helper web page
30:00