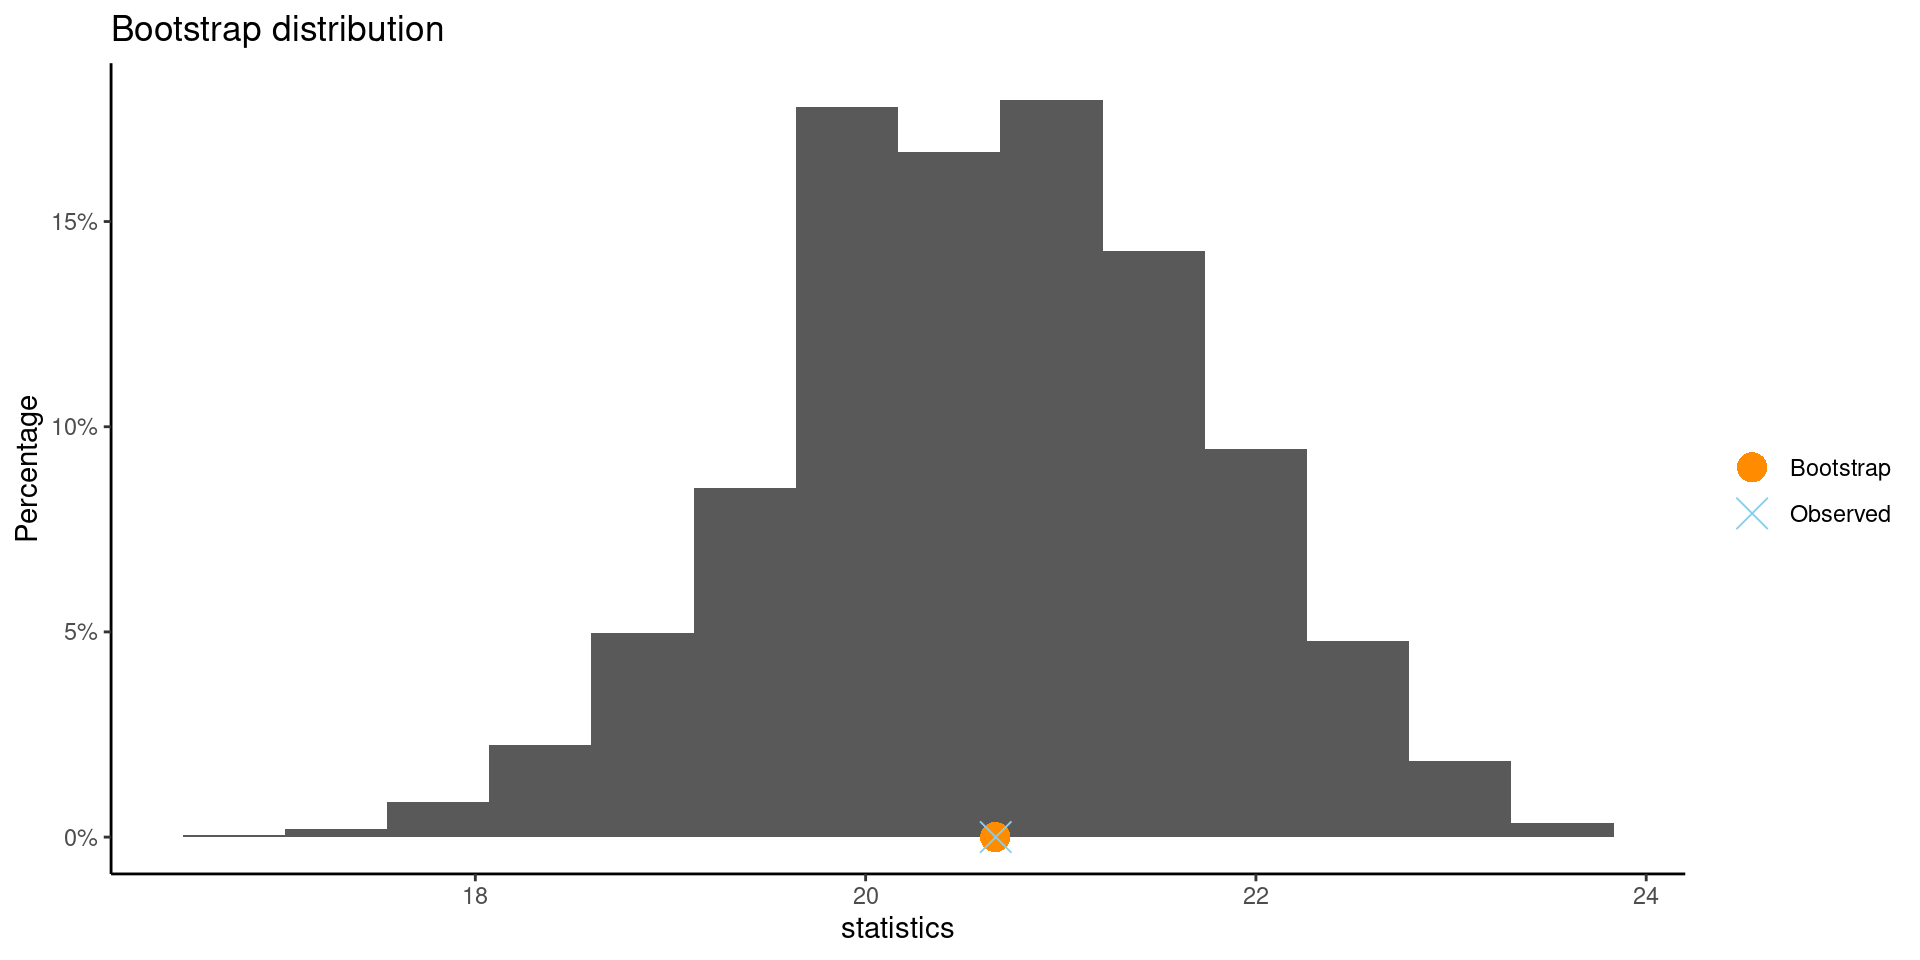
    ** Bootstrap interval for mean

 Observed  X : 20.66667
 Mean of bootstrap distribution: 20.66403
 Standard error of bootstrap distribution: 1.09819

 Bootstrap percentile interval
    2.5%    97.5%
18.50000 22.66667

        *--------------*
STAT 120
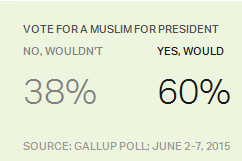
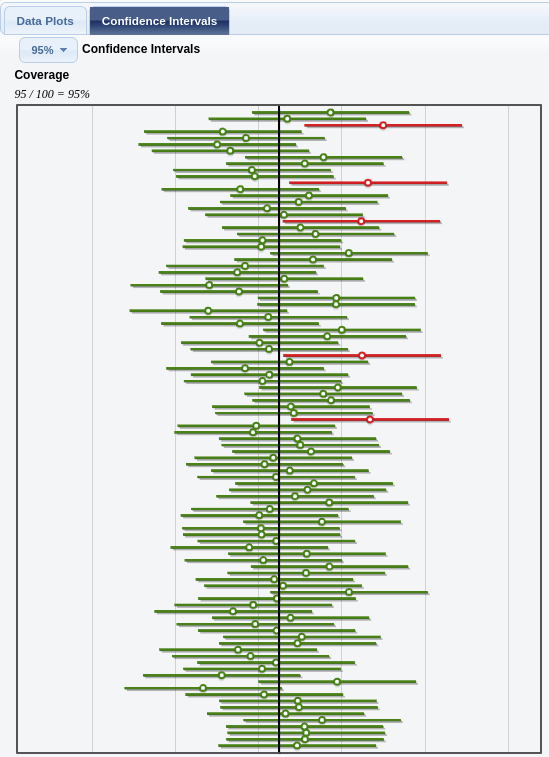
How accurate is an estimate of \(60\%\)?
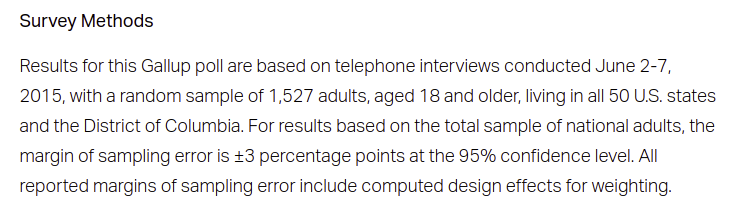
" \(\ldots\) the margin of sampling error is \(\pm\) 3 percentage points at the \(95\%\) confidence level.”
Let’s all go to Statkey web app.

** Bootstrap interval for mean
Observed X : 20.66667
Mean of bootstrap distribution: 20.66403
Standard error of bootstrap distribution: 1.09819
Bootstrap percentile interval
2.5% 97.5%
18.50000 22.66667
*--------------*

30:00